
Visualization Contest: COVID-19, a pandemic with many realities.
The contest is over. We will announce the winner shortly.
---
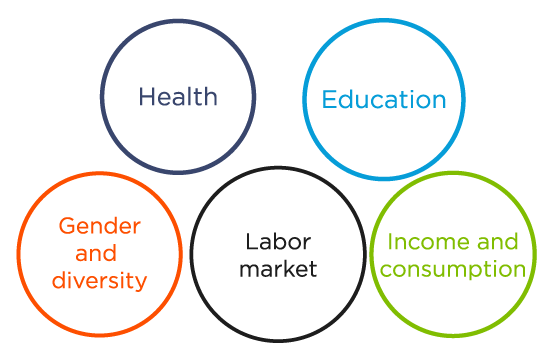
How can we show inequality and its manifestations during the pandemic? Latin America and the Caribbean is the most unequal region in the world. Covid-19 is affecting some populations, cities and people more than others, and is deepening preexisting inequalities. Overcrowding, lack of access to social services and labor markets, informality, non-attendance at school or lack of support for vulnerable populations, such as children, migrants, people with disabilities, peoples, indigenous people, Afro-descendants, LGTBQ + population, are some of the great challenges identified but there are many more challenges.
At the IDB, we want to show that inequality through a graph. We are looking for the best data visualizations to show the reality of the pandemic in our region. You can use our databases, but you can also use any other (or even mix them!). If you use external databases, they must comply with national regulations regarding data protection.


- The winning visualization will be published on the IDB corporate channels and blogs, along with an interview of the author
- Whenever the situation (COVID-19) allows, the winner will be invited to Washington DC to give a presentation on the visualization.

- Fill out this form and upload your graph here!
- Each entry is a visualization. This includes, for example: dashboards, infographics or dynamic visualizations, but not multiple pages.
- A maximum of three entries per participant will be accepted.
- You must enter a link to the visualization and the code that you used to create from the original data (or complete tableau workbook).
- To guarantee objectivity in the evaluation, the displays and codes must not indicate authorship, which will be verified through the submission form.
- You can access our databases here: (http://www.iadb.org/document.cfm?id=EZSHARE-1707297468-112)

- You must be a citizen of one of the IDB member countries
- Borrowers: https://www.iadb.org/es/acerca-del-bid/paises-miembros-prestatarios
- Or non-borrowers: https://www.iadb.org/es/acerca-del-bid/paises-miembros-no-prestatarios
- The intellectual property of the entrys will be from the Inter-American Development Bank
The decision of the contest will be published on the Bank's website and the winners will be communicated via email.
- By sending us the infographic, you accept all the terms and conditions of the contest. In addition, you declare that you have the copyright or the permission to use the infographic presented.

- The delivery period opens on July 1, 2020
- The delivery period closes on July 31, 2020
The judges of the contest are:
- Ricardo Madeira
- Professor, Department of Economics, University of Sao Paulo
- Dante Contreras
- Director of the Center for Conflict and Social Cohesion Studies and Full Professor of the Department of Economics, University of Chile.
- Nora Lustig
- Professor of Economics of Latin America and Director of the Commitment to Equity Institute, Tulane University
- Midori de Habich
- Technical Director, Adt Associates
- Leonardo Gasparini
- Founder and Director of the Center for Distributive, Labor and Social Studies, National University of La Plata
- Nancy Birdall
- President Emeritus and Senior Fellow, Center for Global Development
- Seema Jayachandran
- Professor at the Department of Economics, Northwestern University
- Miguel Szekely
- Director, Center for Educational and Social Studies of Mexico
- Esteban Ortiz-Ospina
- Senior Researcher and Head of Operations, Our World In Data
If you have any questions, please contact us at: [email protected]
Leave a rating